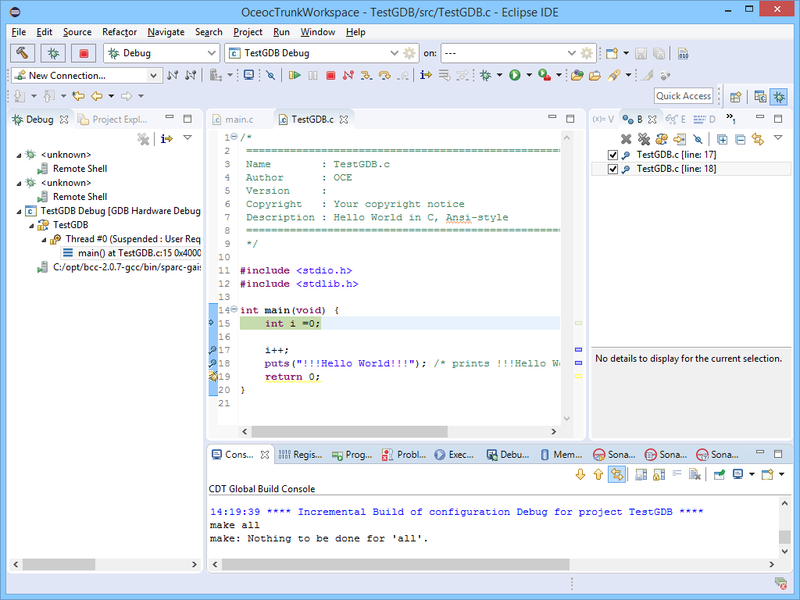
DMON Eclipse debug
Debugging source code with Eclipse TCF
Eclipse TCF Introduction
TCF is a vendor-neutral, lightweight, extensible network protocol mainly for communicating with embedded systems (targets). TCF uses JSON (JavaScript Object Notation) as its preferred data marshalling language and supports auto-discovery of targets and services. TCF is intended to become a replacement for protocols like the GDB Serial, WDB, and GDB/MI protocols used for embedded software development. More information can be found at https://www.eclipse.org/tcf/
Eclipse TCF plug-in can be downloaded from https://www.eclipse.org/tcf/downloads.php. The user needs to select TCF plug-in compatible with installed version of Eclipse.
TCF is supported by DMON from 2.1.0.0 version.
Installing Eclipse TCF
To install TCF plug-in in older versions of Eclipse :
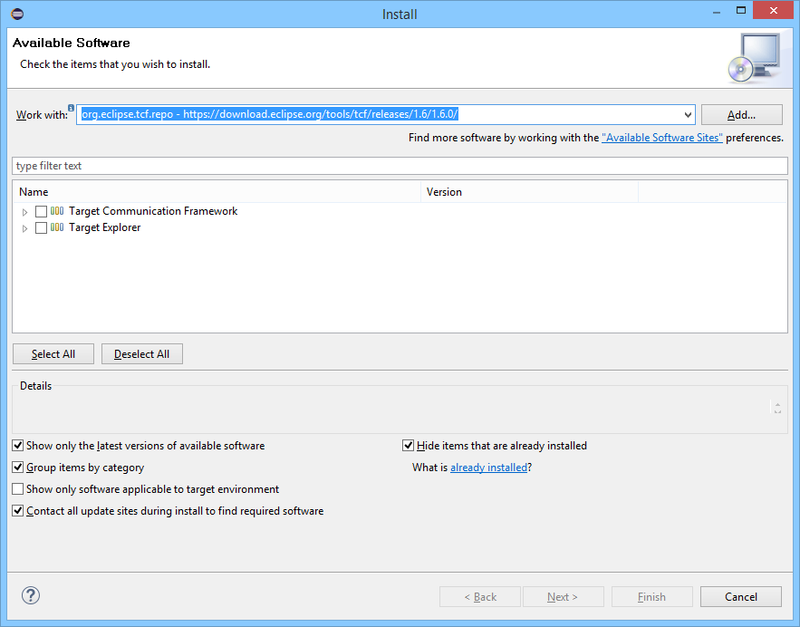
- Eclipse Menu => Help => Install New Software...
- From https://www.eclipse.org/tcf/downloads.php copy "p2 software repository", compatible with version of Eclipse installed on your system
- Replace "type or select a site" with copied link and press "Add.."
- Check "Target Commubication Framework" and click "Next>"
- Follow instruction to set up plug-in.
To install TCF plug-in in Eclipse from 2018 :
- Check if TCF Launch is not available in Debug configurations
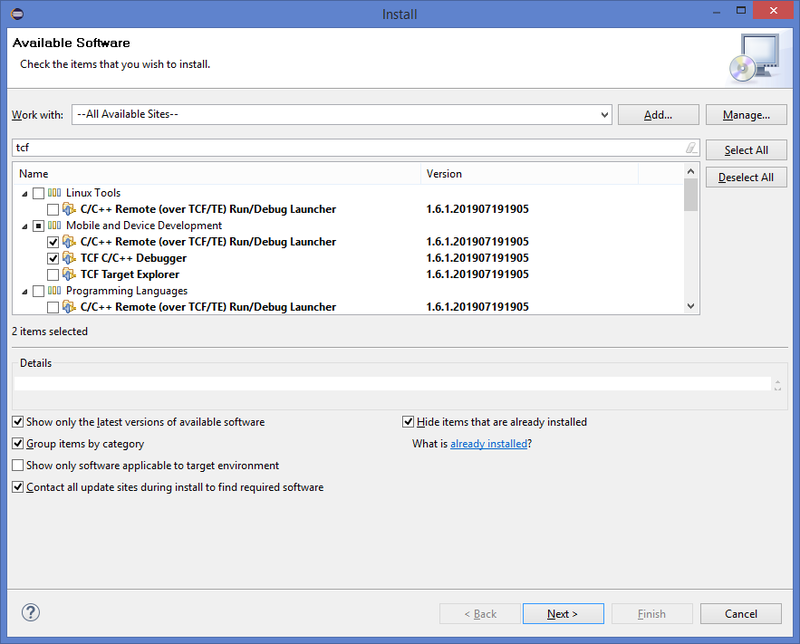
- Eclipse Menu => Help => Install New Software...
- Select "type or select a site" with --All Available Sites-- from drop down menu
- Set tcf on next line to filter out only tcf entries
- Check "C/C++ Remote Launcher" and "TCF C/C++ Debugger" and click "Next>"
- Follow instruction to set up plug-in.
Starting DMON
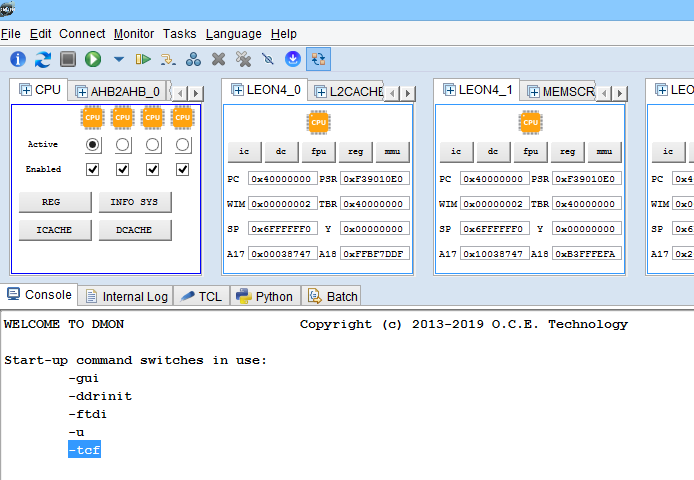
DMON acts as agent between Eclipse TCF plug-in and target. To activate TCF functionality DMON should be started with "-tcf" switch. TCF icon should appear at the bottom of DMON window.
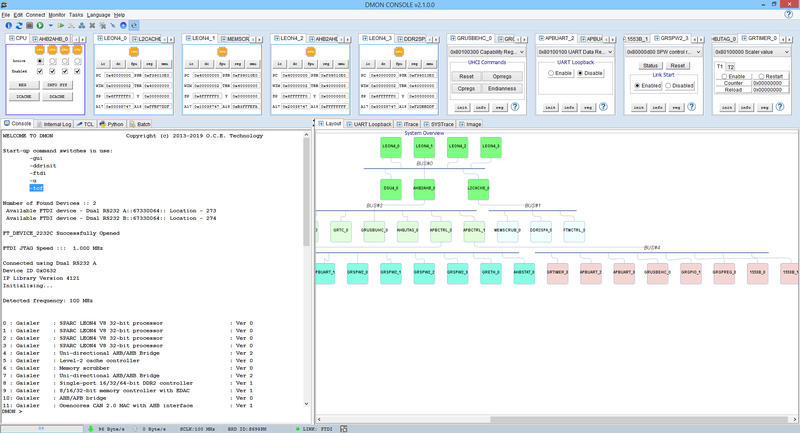
Now DMON is ready for connection. While Eclipse is connected to DMON, DMON commands can be used in parallel. For example, when breakpoint is hit, user can examine memory, registers or cache using DMON commands.
Creating TCF Debug Configurations
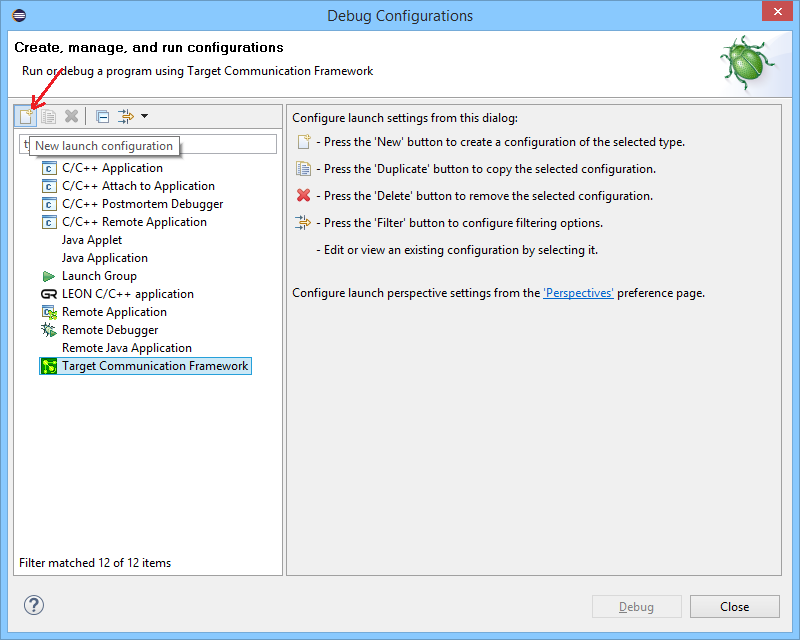
- Open Debug Configurations in Eclipse
- Select 'Target Communication Framework' and press 'New' button to create a configuration of the selected type
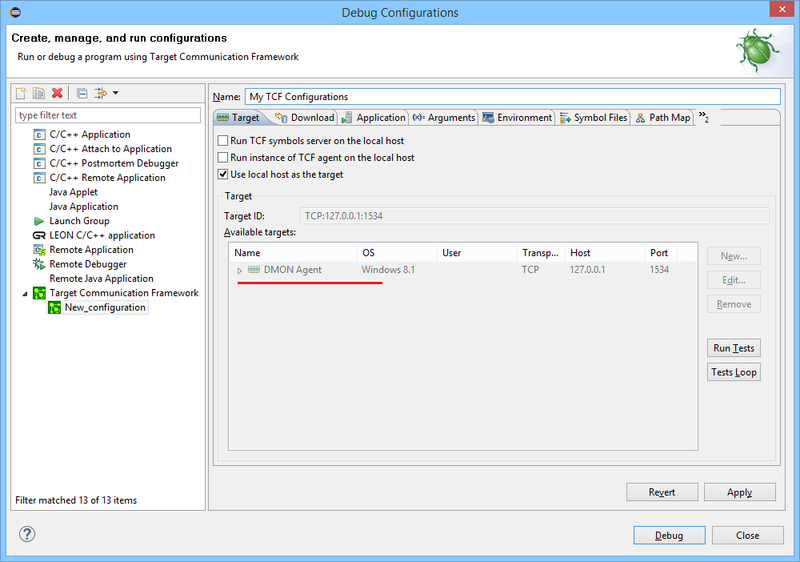
- Change Name of Configuration if have to. In the 'Available targets' DMON Agent should be listed. If not, make sure that DMON is started and '-tcf' switch was used
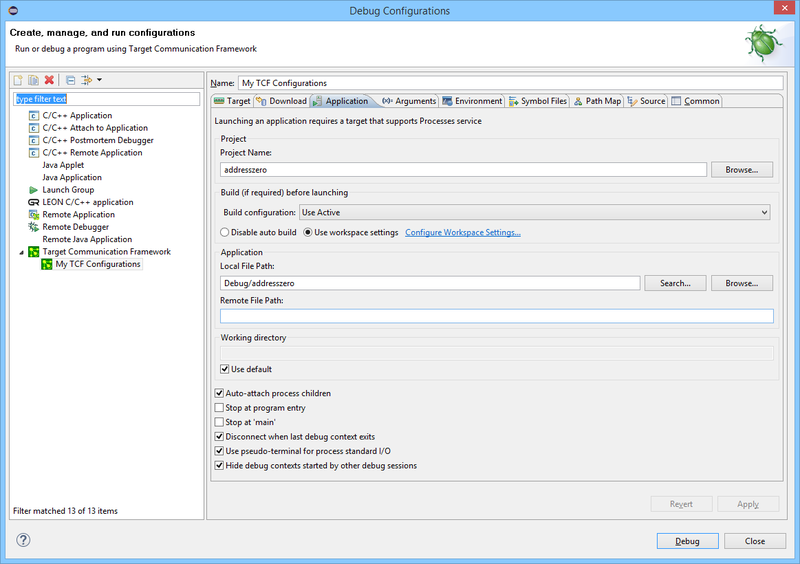
- Select 'Application' tab in 'Debug Configurations' dialog. Set 'Project Name', 'Local File Path' and check or clear available check boxes like 'Stop at main' or 'Stop at program entry'
- Press 'Debug' to start debugging process
Debugging the source code
Debugging source code using Eclipse TCF plug-in and DMON tutorial:
Use this link if problems with youtube above
Debugging multi-core program (single ELF image file)
The sample code used in this tutorial can be copied from here FFTCPU0.c and fft.h
The script to set up all 4 CPUs can be found here mp_script.txt
Use sparc-elf-gcc-4.4.2 to build FFT project with linker flags: -Ttext=0x60000000 -lm
- Build Project
- Add script to initialize all 4 CPUs before start using DMON 'prerun mp_script.txt' command
- Modify TCF Debug Configurations
- Set Break points
- Start application
Multiprocessors Debugging using Eclipse TCF plug-in and DMON tutorial:
Use this link if problems with youtube above
Debugging multi-core program (multiple ELF image files)
One project for each CPU must be created. If 4 CPUs on the target then 4 projects have to be created in Eclipse. The CPU0 project must be first to start and other ELF images can be loaded to the target memory for each CPU using "preproc" DMON command.
The text section of each ELF file can be defined by :
-Wl,-Ttext,0x40000000
passed to the linker. When DMON loads ELF image to memory using "load add[cpu1] dwarf imageName" the Program Counter for CPU1 is set to start of text section of this image.
Each CPU must have own stack pointer as well.
Sample preproc.script :
 load add[cpu1]  dwarf imageForcpu1
 load add[cpu2]  dwarf imageForcpu2
 load add[cpu3]  dwarf imageForcpu3

 stack SRAM_0_END - 0x000010 cpu0
 stack SRAM_0_END - 0x100000 cpu1
 stack SRAM_0_END - 0x200000 cpu2
 stack SRAM_0_END - 0x300000 cpu3
DMON command should be called before debugging started:
preproc pathToPreproc.script
NOTE: DMON "load add[cpu1]" command sets, for example, entry point for CPU1 to the begging of text section of EFL file. It means that CPU1 is running start up code and initialization which CPU0 has done already. If CPU0 has initialized and started using timer for system time then CPU1 will reset the same timer again and time for CPU0 is not correct any more. To avoid this DMON "ep" command can be used to set entry point for each CPU at "main", as all initialization is done by CPU0.
Then preproc.script could look like this :
 load add[cpu1]  dwarf imageForcpu1
 load add[cpu2]  dwarf imageForcpu2
 load add[cpu3]  dwarf imageForcpu3

 ep cpu1:main cpu1
 ep cpu2:main cpu2
 ep cpu3:main cpu3

 stack SRAM_0_END - 0x000010 cpu0
 stack SRAM_0_END - 0x100000 cpu1
 stack SRAM_0_END - 0x200000 cpu2
 stack SRAM_0_END - 0x300000 cpu3
If this script is modified it must be removed first "preproc remove all" and loaded again "preproc pathToPreproc.script".
- Build All Projects
- Start DMON with normally used switches plus "-tcf"
- Run "preproc" DMON command to add script to load the rest of ELF images and initialize all 4 CPUs
- Modify TCF Debug Configurations for CPU0
- Set Break points
- Start application
Multi-core Debugging with multiple ELF files using Eclipse TCF plug-in and DMON:
Use this link if problems with youtube above
Debugging Source code with Eclipse, GDB and DMON
- Download latest Eclipse IDE for C/C++ Developers from https://www.eclipse.org
- Unzip
- Unzip Compilers needed to c:\opt (i.e. C:\opt\sparc-elf-4.4.2-mingw)
- Add “C:\opt\sparc-elf-4.4.2-mingw\bin” and “C:\opt\sparc-elf-4.4.2-mingw\sparc-elf\bin” to System Path
- Download and install CYGWIN from https://www.cygwin.com/
- Add C:\cygwin\bin to the System Path at the beginning
- Install DMON, follow readme in DMON folder
- Start Eclipse
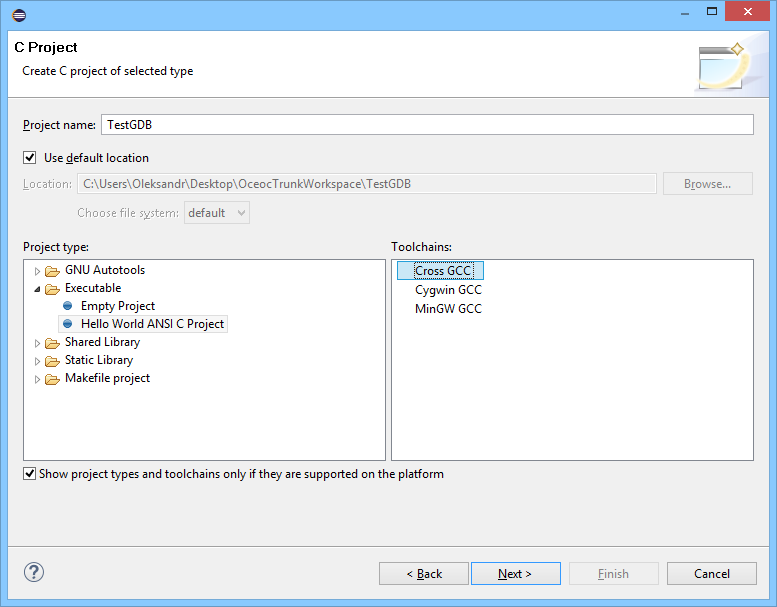
- Select File -> New -> C Project in Eclipse
- Select “Empty Project” or “ Hello world ANSI C Project” and Toolchains : “Cross GCC”
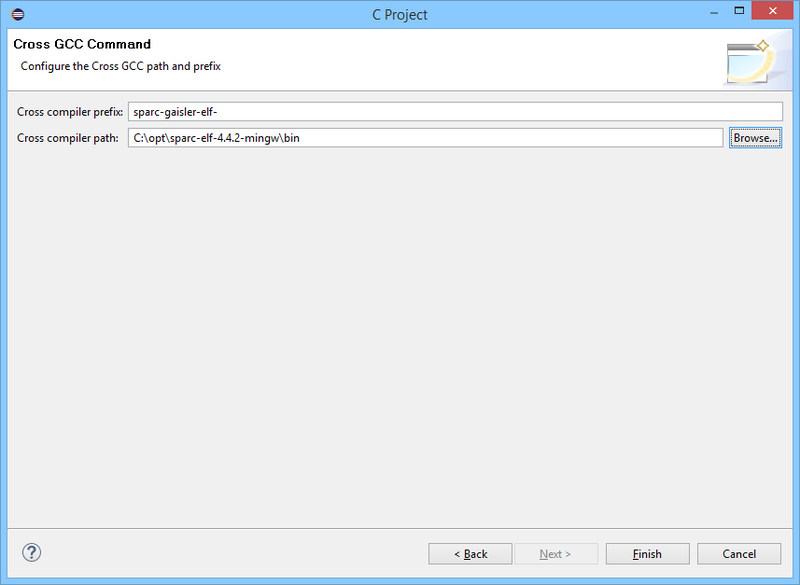
- Select 'Next' to last Dialog to set cross compilers prefix and Path to bin folder and press 'Finish' to create new C project
- Build the Project
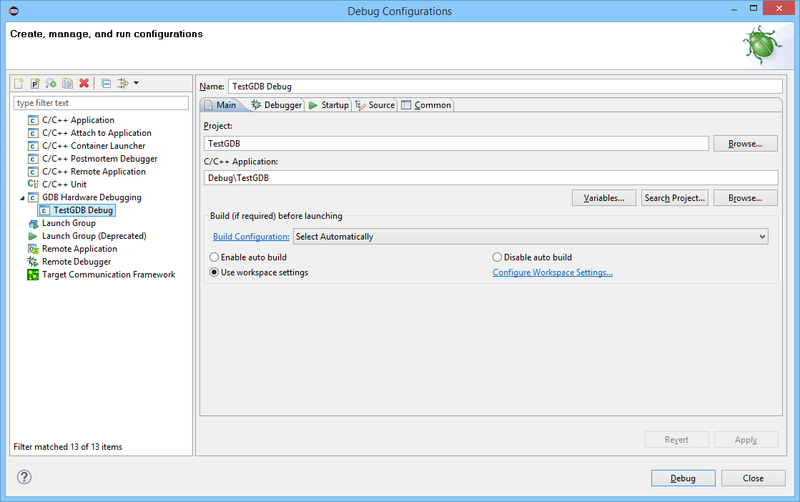
- Select 'Debug Configurations' and create new 'GDB Hardware Debugging'. Set Project and application
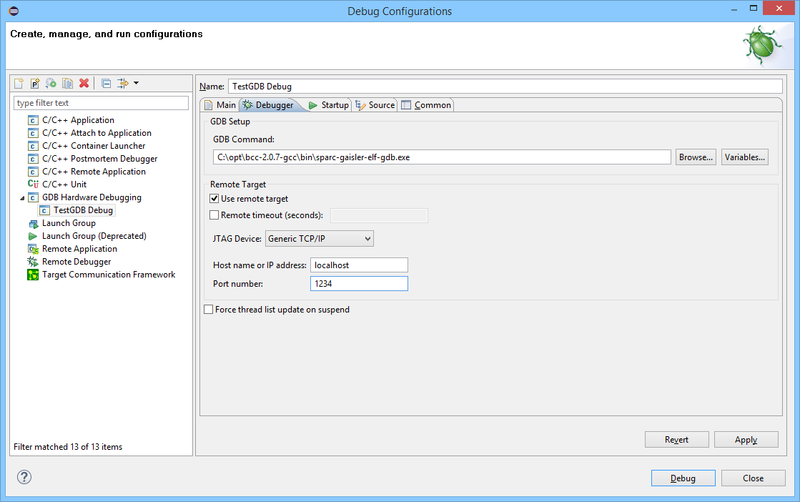
- Configure 'Debugger' section
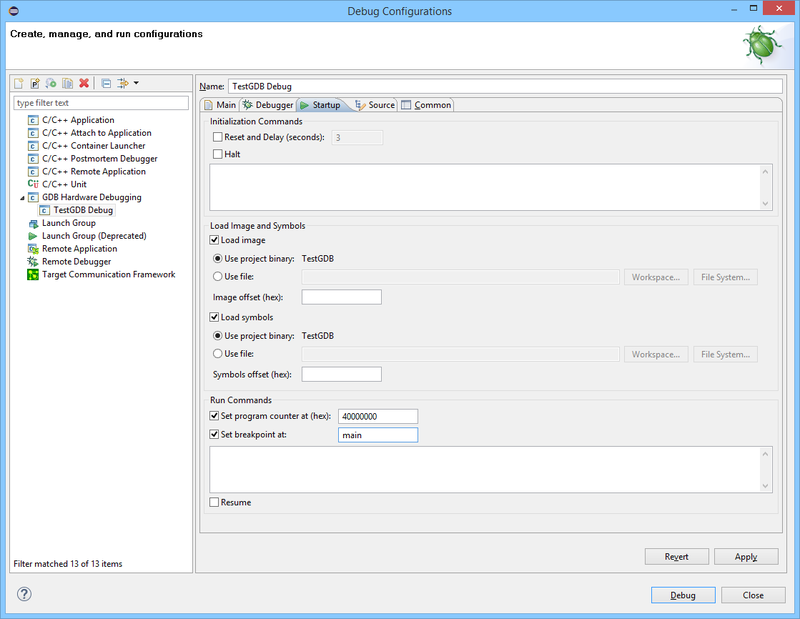
- Configure 'Startup' section if you need
- Press 'Debug' to start debugging. The Program should stop at 'main'.
Debugging source code using Eclipse, GDB and DMON tutorial:
