Difference between revisions of "OCEOS/oceos profiling"
Okhoruzhyy (talk | contribs) |
Okhoruzhyy (talk | contribs) |
||
| Line 32: | Line 32: | ||
[[File:cpu_profile_table.png|600px|Table view]] | [[File:cpu_profile_table.png|600px|Table view]] | ||
[[Media:cpu_profile_table.png|ZOOM]] | |||
The Stack Graph below displays stack for the last minute. Stack displays between MIN and MAX values if specified by user in app_config.c | The Stack Graph below displays stack for the last minute. Stack displays between MIN and MAX values if specified by user in app_config.c | ||
[[File:cpu_profile_stack.png|600px|Stack view]] | [[File:cpu_profile_stack.png|600px|Stack view]] | ||
[[Media:cpu_profile_stack.png|ZOOM]] | |||
The Time Line view below displays system interaction by context over time. Each row presents the context. Tasks are ordered by its priorities, from higher to lower. The first row presents the overall context switch activities. The real time update of Time Line is possible only at 10ms scale by moving the scroll bar to the max on the right. | The Time Line view below displays system interaction by context over time. Each row presents the context. Tasks are ordered by its priorities, from higher to lower. The first row presents the overall context switch activities. The real time update of Time Line is possible only at 10ms scale by moving the scroll bar to the max on the right. | ||
| Line 48: | Line 50: | ||
[[File:cpu_profile_timeline.png|600px|Time Line view]] | [[File:cpu_profile_timeline.png|600px|Time Line view]] | ||
[[Media:cpu_profile_timeline.png|ZOOM]] | |||
Setting the marker by double clicking on the entry in the table | Setting the marker by double clicking on the entry in the table | ||
[[File:cpu_profile_10ms.png|600px|Time Line view at 10ms]] | [[File:cpu_profile_10ms.png|600px|Time Line view at 10ms]] | ||
[[Media:cpu_profile_10ms.png|ZOOM]] | |||
Zoom in to 1 micro second | Zoom in to 1 micro second | ||
[[File:cpu_profile_1.png|600px|Time Line view at 1 micro second]] | [[File:cpu_profile_1.png|600px|Time Line view at 1 micro second]] | ||
[[Media:cpu_profile_1.png|ZOOM]] | |||
Time Line view has some basic controls: | Time Line view has some basic controls: | ||
Revision as of 16:09, 29 March 2022
OCEOS Profiling
Introduction
DMON Commands
oceos profile <status|enable|disable>
- oceos profile displays context switch logging information. This functionality can be enabled/disabled or show current status of the command. Context switch logging should be enabled in OCEOS before this command can be used. More information about context switch logging can be found here.
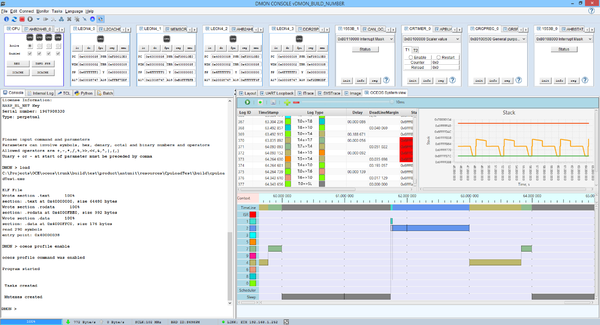
This command can be used only when DMON starts with -gui switch and executable with OCEOS loaded to the target. This view can be displayed in separate window.
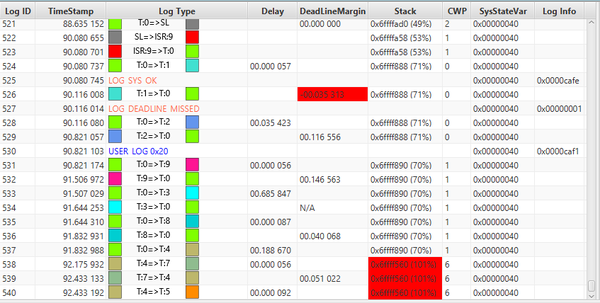
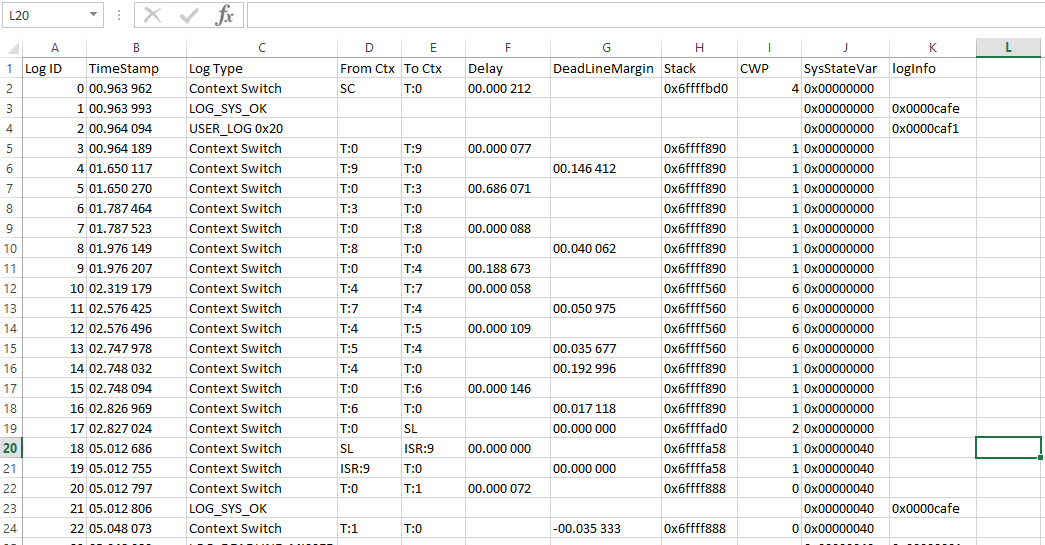
The table below shows all the entries read from the target (system log messages, user log messages, context switching from context to context). DMON reads log area and context switch log area and presents in readable form. Available information for each log entry depends on log type. Log types:
- System log entry
- Displays log error type and extra log information
- User log entry
- Displays user defined value and extra log information
- Switch from task to task
- Starting new task
- Displays delay between request to start the task and actual time when task was started
- Ending task
- Displays remaining time until deadline if was specified by user, when task was created
- Switch from task to scheduler
- Switch from task to sleep
- Also DMON displays stack pointer at the time of context switch, CWP(current window pointer) and system state variable.
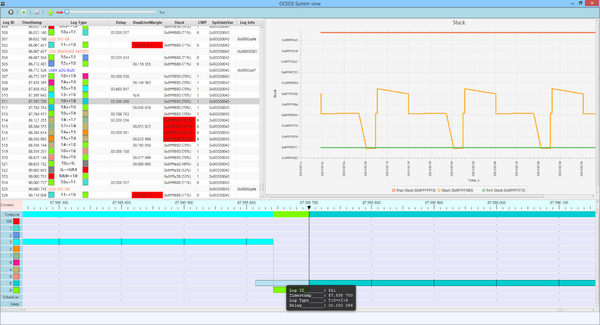
The table allows browsing through the list of log entries, moving from one context to another. Double click on any entry in the table sets the marker on the time line. Zoom in and out can be used only then to have a closer look at selected time frame. Time Line and Stack view are synchronized to match the currently selected entry.
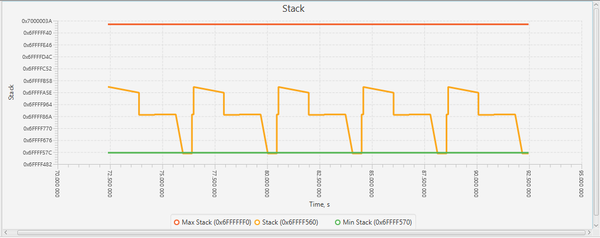
The Stack Graph below displays stack for the last minute. Stack displays between MIN and MAX values if specified by user in app_config.c
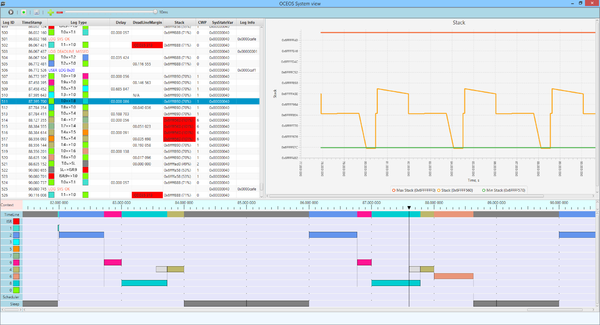
The Time Line view below displays system interaction by context over time. Each row presents the context. Tasks are ordered by its priorities, from higher to lower. The first row presents the overall context switch activities. The real time update of Time Line is possible only at 10ms scale by moving the scroll bar to the max on the right.
Task run time is shown as rectangle filled with task specific color.
Context switches marked with vertical lines.
Grey rectangle before task indicates the time from start request to actual task start.
DMON can detect buffer overrun. The message is printed to the console and red vertical line displayed on the Time Line View. If this happened, context switch log buffer size has to be increased.
Setting the marker by double clicking on the entry in the table
Zoom in to 1 micro second
Time Line view has some basic controls:
- Status (running/paused)
- Button to enable/disable command
- Save button (please see below)
- Slider to change time scale. It is disabled and defaults to 10ms while updating in real time.
Limitations:
- If Context switch buffer is too big it puts constrains on the link to the target. This can happen if the rate, at which the tasks are started, is very frequent. If this is the case then this feature cannot be used and cpuload command is the only choice, as it does not depend on buffer size.
oceos profile save <fileName>
- oceos profile save saves context switch logging to the csv file. This command activates saving to the file. After all content is saved, it continues appending to the file. This command cannot be disabled. Every time when new image is loaded to the target, new csv file is created.
If fileName parameter is not specified, the file is created in DMON User directory: c:\Users\UserName\DMON\UserData
