Difference between revisions of "DMON OCEOS Support"
imported>Okhoruzhyy |
imported>Okhoruzhyy |
||
| (11 intermediate revisions by the same user not shown) | |||
| Line 233: | Line 233: | ||
:'''oceos status''' prints to the console task's block information(asterisk marks currently executing task), status of ready Q (number of tasks waiting on ready Q), number of pending tasks on data Q, number of pending tasks on semaphore Q and number of actions on action Q. The command can be called while application is executing. | :'''oceos status''' prints to the console task's block information(asterisk marks currently executing task), status of ready Q (number of tasks waiting on ready Q), number of pending tasks on data Q, number of pending tasks on semaphore Q and number of actions on action Q. The command can be called while application is executing. | ||
DMON > oceos status | |||
Task info : | Task info : | ||
------------------------------------------------------------------------------------------------- | ------------------------------------------------------------------------------------------------- | ||
| Line 303: | Line 303: | ||
'''oceos status dpq''' prints to the console status of all data Qs used in application (number of entries on data Q and number of tasks on pending Q for that data Q). | '''oceos status dpq''' prints to the console status of all data Qs used in application (number of entries on data Q and number of tasks on pending Q for that data Q). | ||
DMON > oceos status dpq | |||
DataQs info : | DataQs info : | ||
| Line 329: | Line 329: | ||
'''oceos status spq''' prints to the console status of all semaphores used in application (number of permits available and number of tasks on pending Q for that semaphore). | '''oceos status spq''' prints to the console status of all semaphores used in application (number of permits available and number of tasks on pending Q for that semaphore). | ||
DMON > oceos status spq | |||
Semaphores info : | Semaphores info : | ||
| Line 376: | Line 376: | ||
'''oceos status tapq''' prints to the console the list of all actions on timed action Q. This Q is implemented as heap data structure. You can find more information about this feature [[OCEOS_introduction#Timed_output_queue|here]]. | '''oceos status tapq''' prints to the console the list of all actions on timed action Q. This Q is implemented as heap data structure. You can find more information about this feature [[OCEOS_introduction#Timed_output_queue|here]]. | ||
DMON > oceos status tapq | |||
Timed Actions info : | Timed Actions info : | ||
| Line 451: | Line 451: | ||
[[File:cpu_profile_stack.png|600px|Stack view]] | [[File:cpu_profile_stack.png|600px|Stack view]] | ||
The Time Line view below displays system interaction by context over time. Each row presents the context. Tasks are ordered by its priorities, from higher to lower. | The Time Line view below displays system interaction by context over time. Each row presents the context. Tasks are ordered by its priorities, from higher to lower. The first row presents the overall context switch activities. The real time update of Time Line is possible only at 10ms scale by moving the scroll bar to the max on the right. | ||
Task run time is shown as rectangle filled with task specific color. | |||
Context switches marked with vertical lines. | |||
Grey rectangle before task indicates the time from start request to actual task start. | |||
DMON can detect buffer overrun. The message is printed to the console and red vertical line displayed on the Time Line View. If this happened, context switch log buffer size has to be increased. | |||
[[File:cpu_profile_timeline.png|600px|Time Line view]] | |||
Setting the marker by double clicking on the entry in the table | |||
[[File:cpu_profile_10ms.png|600px|Time Line view at 10ms]] | |||
Zoom in to 1 micro second | |||
[[File:cpu_profile_1.png|600px|Time Line view at 1 micro second]] | |||
Time Line view has some basic controls: | |||
*Status (running/paused) | |||
*Button to enable/disable command | |||
*Save button (please see below) | |||
*Slider to change time scale. It is disabled and defaults to 10ms while updating in real time. | |||
'''Limitations:''' | |||
*If Context switch buffer is too big it puts constrains on the link to the target. This can happen if the rate, at which the tasks are started, is very frequent. If this is the case then this feature cannot be used and cpuload command is the only choice, as it does not depend on buffer size. | |||
---- | |||
=== oceos profile save <fileName> === | |||
:'''oceos profile save''' saves context switch logging to the csv file. This command activates saving to the file. After all content is saved, it continues appending to the file. This command cannot be disabled. Every time when new image is loaded to the target, new csv file is created. | |||
If fileName parameter is not specified, the file is created in DMON User directory: c:\Users\UserName\DMON\UserData | |||
[[File:Cpu_profile_save.png|Sample of saved Context switch logging to csv file]] | |||
---- | |||
[[Category:backup]] | [[Category:backup]] | ||
Latest revision as of 17:34, 21 December 2020
DMON OCEOS Support
DMON OCEOS Support is available from DMON v2.1.0.1
All available commands to support OCEOS can be displayed by issuing :
DMON > help oceos
DMON Commands
oceos info
- oceos info command displays OCEOS configurations. DMON finds symbol sysMetaPtr and reads all the fields and displays every struct members with location in memory and its values.
Please read article on getting started with OCEOS.
This command can be used only after the scheduling was started. On the page above we talk about three areas that application hast to set up : LOG_DATA_ARRAY_SIZE_U32S, FIXED_DATA_ARRAY_SIZE_U32S and DYN_DATA_ARRAY_SIZE_U32S. User has to calculate those areas and that depends on application needs. To simplify, we provide Excel document which can be used to give all the sizes, or user can put those sizes bigger as needed and use oceoos info command to display actual sizes.
Each of those areas is guarded by sentinel, so oceos info command checks the sentinels are still in place and not overridden.
DMON > oceos info

Struct Field Name : *system_log_ptr                :: location 0x40016444 :: pointer 0x4001A0E0 :: size 0x109 :: sentinel OK
Struct Field Name : *data_fixed_ptr                :: location 0x40016448 :: pointer 0x4001643C :: size 0x59 :: sentinel OK
Struct Field Name : *data_dynamic_ptr              :: location 0x4001644C :: pointer 0x400180E0 :: size 0x258 :: sentinel OK
Struct Field Name : *system_stack_ptr              :: location 0x40016450 :: pointer 0x0
Struct Field Name : *system_stack_limit_ptr        :: location 0x40016454 :: pointer 0x0
Struct Field Name : *logFullFunction               :: location 0x40016458 :: pointer 0x40000458
Struct Field Name : *systemProblemFunction         :: location 0x4001645C :: pointer 0x40000440
Struct Field Name : numberOfTasks                  :: location 0x40016460 :: value 0x8
Struct Field Name : numberOfMutexes                :: location 0x40016460 :: value 0x1
Struct Field Name : number_of_semaphores           :: location 0x40016460 :: value 0x1
Struct Field Name : number_of_dataqs               :: location 0x40016460 :: value 0x1
Struct Field Name : timed_actions_number           :: location 0x40016464 :: value 0x16
Struct Field Name : user_traps_number              :: location 0x40016464 :: value 0x0
Struct Field Name : watchdog_window                :: location 0x40016464 :: value 0x0
Struct Field Name : watchdog_timeout               :: location 0x40016468 :: value 0x0
Struct Field Name : totalReadyQ                    :: location 0x4001646C :: value 0x11
Struct Field Name : action_time_interrupt          :: location 0x4001646C :: value 0xE
Struct Field Name :                                :: location 0x4001646C :: value 0x2E
Struct Field Name : logEntries                     :: location 0x4001646C :: value 0x40
Struct Field Name : totalJobs                      :: location 0x40016470 :: value 0x3E
Struct Field Name : logCreated                     :: location 0x40016470 :: value 0x1
Struct Field Name : init_start_set_up              :: location 0x40016470 :: value 0x1
Struct Field Name : init_finished                  :: location 0x40016470 :: value 0x1
Struct Field Name : interrupt_nesting_enabled      :: location 0x40016470 :: value 0x1
Struct Field Name : total_sem_pending_jobs         :: location 0x40016470 :: value 0x10
Struct Field Name : total_dataQ_pending_jobs       :: location 0x40016474 :: value 0x6
Struct Field Name : total_dataQ_entries            :: location 0x40016474 :: value 0xA
Struct Field Name :                                :: location 0x40016478 :: value 0x1
Struct Field Name : watchdog_timer_index           :: location 0x40016478 :: value 0x0
Struct Field Name : sys_time_timer_index           :: location 0x40016478 :: value 0x2
Struct Field Name : timed_actions_timer_index      :: location 0x40016478 :: value 0x3
Struct Field Name : CS_log_entries_base2           :: location 0x40016478 :: value 0x5
Struct Field Name :                                :: location 0x40016478 :: value 0xBABE
Struct Field Name : *tasksFixedPtr                 :: location 0x4001647C :: pointer 0x400164CC
Struct Field Name : *mutexCeilingsPtr              :: location 0x40016480 :: pointer 0x4001658C
Struct Field Name : *sem_fixed_data_ptr            :: location 0x40016484 :: pointer 0x40016590
Struct Field Name : *dataq_fixed_data_ptr          :: location 0x40016488 :: pointer 0x40016594
Struct Field Name : *trap_ID_ptr                   :: location 0x4001648C :: pointer 0x40016598
Struct Field Name : *trap_handler_ptr              :: location 0x40016490 :: pointer 0x40016598
Struct Field Name : *fixed_data_checksum_ptr       :: location 0x40016494 :: pointer 0x40016598
Struct Field Name : *dynamic_meta_ptr              :: location 0x40016498 :: pointer 0x400180E8
Struct Field Name : *priorityStackPtr              :: location 0x4001649C :: pointer 0x400180EC
Struct Field Name : *taskDynamicPtr                :: location 0x400164A0 :: pointer 0x400180F8
Struct Field Name : *jobsArrayPtr                  :: location 0x400164A4 :: pointer 0x40018278
Struct Field Name : *readyQPtr                     :: location 0x400164A8 :: pointer 0x400189F8
Struct Field Name : *mutexDynamicPtr               :: location 0x400164AC :: pointer 0x40018658
Struct Field Name : *semaphore_list_ptr            :: location 0x400164B0 :: pointer 0x4001865C
Struct Field Name : *semaphore_pen_q_array_ptr     :: location 0x400164B4 :: pointer 0x40018664
Struct Field Name : *dataq_list_ptr                :: location 0x400164B8 :: pointer 0x40018684
Struct Field Name : *dataq_pen_q_array_ptr         :: location 0x400164BC :: pointer 0x40018694
Struct Field Name : *dataq_data_aray_ptr           :: location 0x400164C0 :: pointer 0x400186A0
Struct Field Name : *timed_action_ptr              :: location 0x400164C4 :: pointer 0x400186C8
Struct Field Name : *timed_q_ptr                   :: location 0x400164C8 :: pointer 0x400189E0
oceos log <last|all>
- oceos log reads and displays system log messages to the console. If third flag is not set, defaults to oceos log last. This command also checks if log sentinel is ok. This command can be executed while program is running.
oceos log last prints last system log message
DMON > oceos log

Struct Field Name : *system_log_ptr                :: location 0x4001009C :: pointer 0x4001063C :: size 0xA9 :: sentinel OK
OCEOS log entry :
index ::    2 | time32 :: 25.149 954 | type :: LOG_DEADLINE_MISSED                      | comment :: 0x1
oceos log all prints all system log messages in descending order.
DMON > oceos log all

Struct Field Name : *system_log_ptr                :: location 0x4001009C :: pointer 0x4001063C :: size 0xA9 :: sentinel OK
OCEOS log entries :
index ::    0 | time32 :: 21.806 433 | type :: null                                     | comment :: 0xCAF1
index ::   15 | time32 :: 21.101 377 | type :: LOG_DEADLINE_MISSED                      | comment :: 0x1
index ::   14 | time32 :: 21.066 108 | type :: LOG_SYS_OK                               | comment :: 0xCAFE
index ::   13 | time32 :: 17.757 858 | type :: null                                     | comment :: 0xCAF1
index ::   12 | time32 :: 17.052 800 | type :: LOG_DEADLINE_MISSED                      | comment :: 0x1
index ::   11 | time32 :: 17.017 531 | type :: LOG_SYS_OK                               | comment :: 0xCAFE
index ::   10 | time32 :: 13.709 280 | type :: null                                     | comment :: 0xCAF1
index ::    9 | time32 :: 13.004 223 | type :: LOG_DEADLINE_MISSED                      | comment :: 0x1
index ::    8 | time32 :: 12.968 954 | type :: LOG_SYS_OK                               | comment :: 0xCAFE
index ::    7 | time32 :: 09.660 703 | type :: null                                     | comment :: 0xCAF1
index ::    6 | time32 :: 08.955 648 | type :: LOG_DEADLINE_MISSED                      | comment :: 0x1
index ::    5 | time32 :: 08.920 378 | type :: LOG_SYS_OK                               | comment :: 0xCAFE
index ::    4 | time32 :: 05.612 184 | type :: null                                     | comment :: 0xCAF1
index ::    3 | time32 :: 04.907 118 | type :: LOG_DEADLINE_MISSED                      | comment :: 0x1
index ::    2 | time32 :: 04.871 844 | type :: LOG_SYS_OK                               | comment :: 0xCAFE
index ::    1 | time32 :: 00.823 133 | type :: null                                     | comment :: 0xCAF1
oceos state
- oceos state command prints to the console system state variables. OCEOS has two state variables : one permanent and cannot be reset and another can be reset by application. This command can be executed while program is running.
DMON reads the state variables and prints description to the console.
DMON > oceos state

Struct Field Name : *system_log_ptr                :: location 0x4001009C :: pointer 0x4001063C :: size 0xA9 :: sentinel OK
State Value           :: 0x40
0x00000040 STATUS_JOB_OVER_TIME        Job time from creation to completion exceeds allowed maximum for a task.
OCEOS Permanent Value :: 0x40
0x00000040 STATUS_JOB_OVER_TIME        Job time from creation to completion exceeds allowed maximum for a task.
oceos itask <taskId|all>
- oceos itask displays fixed task information and dynamic task information to the console. This command can be executed while program is running.
oceos itask taskId displays information for task with specified ID.
DMON > oceos itask 1

---------------------------------------------------------------------------------------
Task 1 :: Fixed Data Pointer 0x4001013C Dynamic Data Pointer 0x400103B0
 Task Fixed Data:
    Task Priority                  :: 0x00000002 (2)
    Task Threshold                 :: 0x00000002 (2)
    Task Max Jobs                  :: 0x00000001 (1)
    Task Start Status              :: enabled
    Task Start Address             :: 0x40000DFC (cpuLoadTest:fun1)
    Task Kill Function Address     :: 0x40000DFC (cpuLoadTest:fun1)
    Task Deadline time             :: 0x0000000F (00.000 015)
    Task Min Time Between Starts   :: 0x0000000A (00.000 010)
  Task Dynamic Data:
    Task Status                    :: TASK_ENABLED
    Current Number of Jobs         :: 0x00000000 (0)
    Max Number of current Jobs     :: 0x00000001 (1)
    Number of times started        :: 0x00000009 (9)
    TimeCurrentExec                :: 0x000089C7 (00.035 271)
    TimeMaxDelay                   :: 0x00000049 (00.000 073)
    TimeMaxFinish                  :: 0x00008A15 (00.035 349)
    TimeMaxExec                    :: 0x000089CC (00.035 276)
    TimeTotalExecLow               :: 0x0004D802 (00.317 442)
    TimeTotalExecHigh              :: 0x00000000 (00.000 000)
    TimeMinGapStarts               :: 0x003DC6A6 (04.048 550)
    TimeMinGapFinishStart          :: 0x003D3C91 (04.013 201)
    TimeLastStart                  :: 0x023B95B1 (37.459 377)
    TimeLastFinish                 :: 0x023C1FB1 (37.494 705)
    PreemptMax                     :: 0x00000000 (0)
---------------------------------------------------------------------------------------
oceos itask all displays information for all tasks.
DMON > oceos itask all

---------------------------------------------------------------------------------------
Task 0 :: Fixed Data Pointer 0x40010124 Dynamic Data Pointer 0x40010380
 Task Fixed Data:
    Task Priority                  :: 0x000000FE (254)
    Task Threshold                 :: 0x000000FE (254)
    Task Max Jobs                  :: 0x00000001 (1)
    Task Start Status              :: enabled
    Task Start Address             :: 0x40000CE4 (cpuLoadTest:fun0)
    Task Kill Function Address     :: 0x40000CE4 (cpuLoadTest:fun0)
    Task Deadline time             :: 0x00000000 (00.000 000)
    Task Min Time Between Starts   :: 0x00000000 (00.000 000)
  Task Dynamic Data:
    Task Status                    :: TASK_ENABLED
    Current Number of Jobs         :: 0x00000001 (1)
    Max Number of current Jobs     :: 0x00000001 (1)
    Number of times started        :: 0x00000001 (1)
    TimeCurrentExec                :: 0x00D1D5F9 (13.751 801)
    TimeMaxDelay                   :: 0x000000D3 (00.000 211)
    TimeMaxFinish                  :: 0x00000000 (00.000 000)
    TimeMaxExec                    :: 0x00000000 (00.000 000)
    TimeTotalExecLow               :: 0x00000000 (00.000 000)
    TimeTotalExecHigh              :: 0x00000000 (00.000 000)
    TimeMinGapStarts               :: 0xFFFFFFFF (4294.967 295)
    TimeMinGapFinishStart          :: 0xFFFFFFFF (4294.967 295)
    TimeLastStart                  :: 0x000F9777 (01.021 815)
    TimeLastFinish                 :: 0x00000000 (00.000 000)
    PreemptMax                     :: 0x00000000 (0)
---------------------------------------------------------------------------------------
 ...
---------------------------------------------------------------------------------------
Task 9 :: Fixed Data Pointer 0x400101FC Dynamic Data Pointer 0x40010530
 Task Fixed Data:
    Task Priority                  :: 0x00000004 (4)
    Task Threshold                 :: 0x00000004 (4)
    Task Max Jobs                  :: 0x00000001 (1)
    Task Start Status              :: enabled
    Task Start Address             :: 0x40001160 (cpuLoadTest:fun9)
    Task Kill Function Address     :: 0x00000000 ()
    Task Deadline time             :: 0x000CB3A1 (00.832 417)
    Task Min Time Between Starts   :: 0x003DC6B3 (04.048 563)
  Task Dynamic Data:
    Task Status                    :: TASK_ENABLED
    Current Number of Jobs         :: 0x00000001 (1)
    Max Number of current Jobs     :: 0x00000001 (1)
    Number of times started        :: 0x0000000A (10)
    TimeCurrentExec                :: 0x00000000 (00.000 000)
    TimeMaxDelay                   :: 0x0000004D (00.000 077)
    TimeMaxFinish                  :: 0x000A7749 (00.685 897)
    TimeMaxExec                    :: 0x000A76FC (00.685 820)
    TimeTotalExecLow               :: 0x005E2E2E (06.172 206)
    TimeTotalExecHigh              :: 0x00000000 (00.000 000)
    TimeMinGapStarts               :: 0x003DC688 (04.048 520)
    TimeMinGapFinishStart          :: 0x00334F66 (03.362 662)
    TimeLastStart                  :: 0x0246E1E5 (38.199 781)
    TimeLastFinish                 :: 0x02139242 (34.837 058)
    PreemptMax                     :: 0x00000000 (0)
---------------------------------------------------------------------------------------
oceos status <rq|dpq|spq|tapq>
- oceos status prints to the console task's block information(asterisk marks currently executing task), status of ready Q (number of tasks waiting on ready Q), number of pending tasks on data Q, number of pending tasks on semaphore Q and number of actions on action Q. The command can be called while application is executing.
DMON > oceos status
Task info :
   -------------------------------------------------------------------------------------------------
   | ID |Prio|MaxJobs|CurJobs|MaxCurJobs|Total|MaxPreempt|MUX |Status         |Origin              |
   -------------------------------------------------------------------------------------------------
   | 0  | 6  | 10    | 0     | 1        | 15  | 0        | 0  |TASK_ENABLED   |                    |
   -------------------------------------------------------------------------------------------------
   | 1  | 7  | 10    | 0     | 1        | 12  | 0        | 0  |TASK_ENABLED   |                    |
   -------------------------------------------------------------------------------------------------
   | 2  | 16 | 10    | 3     | 3        | 13  | 0        | 0  |TASK_ENABLED   |                    |
   -------------------------------------------------------------------------------------------------
   | 3  | 17 | 10    | 0     | 1        | 10  | 1        | 0  |TASK_ENABLED   |                    |
   -------------------------------------------------------------------------------------------------
   | 4  | 200| 1     | 1     | 1        | 1   | 0        | 0  |TASK_ENABLED * |FROM_START          |
   -------------------------------------------------------------------------------------------------

Ready Q info :
   --------------------------------------------------------------------------
   |N% |ID |Prio|Preempt|Origin              |Status                        |
   --------------------------------------------------------------------------
   |0  |4  |200 |50     |FROM_START          |JOB_EXECUTING                 |
   --------------------------------------------------------------------------

DataQs info :
DataQ 0 info :
   DataQ 0 has 0 entries
   DataQ 0 pending Q is empty

DataQ 1 info :
   DataQ 1 has 0 entries
   --------------------------------------------------------------------------
   |N% |ID |Prio|Preempt|Origin              |Status                        |
   --------------------------------------------------------------------------
   |0  |2  |16  |0      |FROM_START          |JOB_DATAQ_PENDING             |
   --------------------------------------------------------------------------
   |1  |2  |16  |0      |FROM_START          |JOB_DATAQ_PENDING             |
   --------------------------------------------------------------------------
   |2  |2  |16  |0      |FROM_START          |JOB_DATAQ_PENDING             |
   --------------------------------------------------------------------------

DataQ 2 info :
   DataQ 2 has 0 entries
   DataQ 2 pending Q is empty

Semaphores info :
   Semaphores are not used

Timed Actions info :
   --------------------------------------------------------------------------------------------------------------------------------
   |ActionPtr |Time            |TimeBefore|TimeAfter |ActionType        |Status    |TaskID|Address   |Value     |Mask      |Info  |
   --------------------------------------------------------------------------------------------------------------------------------
oceos status rq prints to the console status of ready Q (number of tasks waiting on ready Q) in the order they found on ready Q. The ready Q in OCEOS is implemented as heap data structure (tree-based data structure) based on task's priority. The heap is not a sorted structure; it can be regarded as being partially ordered. So, the list of tasks printed on the screen does not mean that tasks are executed in order they appear.
DMON > oceos status rq

Ready Q info :
   --------------------------------------------------------------------------
   |N% |ID |Prio|Preempt|Origin              |Status                        |
   --------------------------------------------------------------------------
   |0  |7  |4   |0      |FROM_START          |JOB_EXECUTING                 |
   --------------------------------------------------------------------------
   |1  |4  |5   |1      |FROM_START          |JOB_ACTIVE                    |
   --------------------------------------------------------------------------
   |2  |0  |254 |5      |FROM_START          |JOB_ACTIVE                    |
   --------------------------------------------------------------------------
oceos status dpq prints to the console status of all data Qs used in application (number of entries on data Q and number of tasks on pending Q for that data Q).
DMON > oceos status dpq

DataQs info :

DataQ 0 info :
   DataQ 0 has 0 entries
   DataQ 0 pending Q is empty

DataQ 1 info :
   DataQ 1 has 0 entries
   --------------------------------------------------------------------------
   |N% |ID |Prio|Preempt|Origin              |Status                        |
   --------------------------------------------------------------------------
   |0  |2  |16  |0      |FROM_START          |JOB_DATAQ_PENDING             |
   --------------------------------------------------------------------------
   |1  |2  |16  |0      |FROM_START          |JOB_DATAQ_PENDING             |
   --------------------------------------------------------------------------
   |2  |2  |16  |0      |FROM_START          |JOB_DATAQ_PENDING             |
   --------------------------------------------------------------------------

DataQ 2 info :
   DataQ 2 has 0 entries
   DataQ 2 pending Q is empty
oceos status spq prints to the console status of all semaphores used in application (number of permits available and number of tasks on pending Q for that semaphore).
DMON > oceos status spq

Semaphores info :

   Semaphore 0 info :
   Semaphore 0 has 0 permits
   Semaphore 0 pending Q list:
   --------------------------------------------------------------------------
   |N% |ID |Prio|Preempt|Origin              |Status                        |
   --------------------------------------------------------------------------
   |0  |3  |66  |0      |FROM_SEM_PENDING_Q  |JOB_SEMAPHORE_PENDING         |
   --------------------------------------------------------------------------
   |1  |3  |66  |0      |FROM_SEM_PENDING_Q  |JOB_SEMAPHORE_PENDING         |
   --------------------------------------------------------------------------
   |2  |3  |66  |0      |FROM_SEM_PENDING_Q  |JOB_SEMAPHORE_PENDING         |
   --------------------------------------------------------------------------
   |3  |3  |66  |0      |FROM_SEM_PENDING_Q  |JOB_SEMAPHORE_PENDING         |
   --------------------------------------------------------------------------

   Semaphore 1 info :
   Semaphore 1 has 0 permits
   Semaphore 1 pending Q list:
   --------------------------------------------------------------------------
   |N% |ID |Prio|Preempt|Origin              |Status                        |
   --------------------------------------------------------------------------
   |0  |2  |12  |0      |FROM_START          |JOB_SEMAPHORE_PENDING         |
   --------------------------------------------------------------------------

   Semaphore 2 info :
   Semaphore 2 has 0 permits
   Semaphore 2 pending Q list:
   --------------------------------------------------------------------------
   |N% |ID |Prio|Preempt|Origin              |Status                        |
   --------------------------------------------------------------------------
   |0  |1  |64  |1      |FROM_START          |JOB_SEMAPHORE_PENDING         |
   --------------------------------------------------------------------------

   Semaphore 3 info :
   Semaphore 3 has 4095 permits
   Semaphore 3 pending Q is empty

   Semaphore 4 info :
   Semaphore 4 has 0 permits
   Semaphore 4 pending Q is empty
oceos status tapq prints to the console the list of all actions on timed action Q. This Q is implemented as heap data structure. You can find more information about this feature here.
DMON > oceos status tapq

Timed Actions info :
   --------------------------------------------------------------------------------------------------------------------------------
   |ActionPtr |Time            |TimeBefore|TimeAfter |ActionType        |Status    |TaskID|Address   |Value     |Mask      |Info  |
   --------------------------------------------------------------------------------------------------------------------------------
   |0x3000224c|03.145 725      |00.001 000|00.001 000|WRITE_ACTION      |Active    |-1    |0x40000000|0xdeadbeef|0x0       |0x0   |
   --------------------------------------------------------------------------------------------------------------------------------
   |0x30002270|06.291 450      |00.001 000|00.001 000|WRITE_ACTION      |Active    |-1    |0x40000004|0xdeadbef0|0x0       |0x0   |
   --------------------------------------------------------------------------------------------------------------------------------
   |0x30002294|09.437 175      |00.001 000|00.001 000|WRITE_ACTION      |Active    |-1    |0x40000008|0xdeadbef1|0x0       |0x0   |
   --------------------------------------------------------------------------------------------------------------------------------
   |0x300022b8|12.582 900      |00.001 000|00.001 000|RMW_ACTION        |Active    |-1    |0x4000000c|0xffffffff|0x1000001 |0x0   |
   --------------------------------------------------------------------------------------------------------------------------------
   |0x300022dc|15.728 625      |00.001 000|00.001 000|START_JOB_ACTION  |Active    |1     |0x0       |0x0       |0x0       |0x0   |
   --------------------------------------------------------------------------------------------------------------------------------
   |0x30002300|15.728 625      |00.001 000|00.001 000|START_JOB_ACTION  |Active    |1     |0x0       |0x0       |0x0       |0x0   |
   --------------------------------------------------------------------------------------------------------------------------------
oceos cpuload <status|enable|disable>
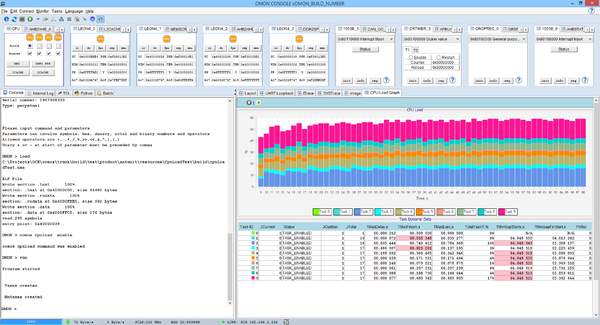
- oceos cpuload displays task's statistical information while application is running. This command can be used only when DMON starts with -gui switch. This feature can be enabled or disabled. If activated, DMON creates CPU load graph. This view can be displayed in separate window, if double clicked on the tab
 . This command can be used only if executable with OCEOS is loaded to the target. CPU load view shows cpu utilization by each task. Task Dynamic Data view shows statistical task information, read from the target in 1000ms interval. Pink color in table cells indicates the violation of the parameter. When task is created two timing measurements can be specified by user. Every time DMON reads dynamic data these values are compared against user set values and if violated, sets pink background. Hoover over the table header to get more information about each of the measurements.
This feature can be disable/enabled by pressing on the button ![]() .
.
The Contexts table include following measures:
- TaskID
- JCurrent => Current number of jobs created
- Status => Task status (enabled or disabled)
- JCurMax => Maximum number of current jobs for this task
- JTotal => Number of times this task was started
- TMaxDelay => Maximum time the job is waiting on ready Q before becoming active
- TMaxFinish => Maximum time to finish job executing after starting
- TMaxExec => Maximum time spent executing
- TotalTaskT => Task Time spent running, % of total time
- TMinGapStarts => Minimum time between job creations
- TMinGapFinStart => Minimum time between job ending and new job creation
- PrMax => Maximum times any job was pre-empted
oceos profile <status|enable|disable>
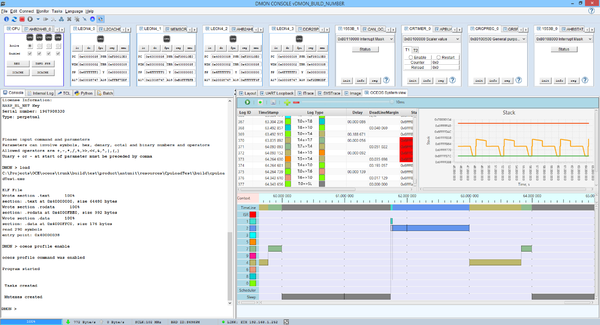
- oceos profile displays context switch logging information. This functionality can be enabled/disabled or show current status of the command. Context switch logging should be enabled in OCEOS before this command can be used. More information about context switch logging can be found here.
This command can be used only when DMON starts with -gui switch and executable with OCEOS loaded to the target. This view can be displayed in separate window.
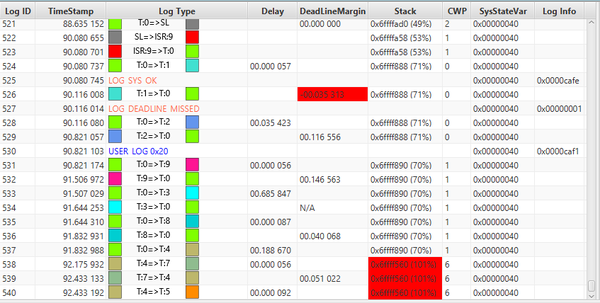
The table below shows all the entries read from the target (system log messages, user log messages, context switching from context to context). DMON reads log area and context switch log area and presents in readable form. Available information for each log entry depends on log type. Log types:
- System log entry
- Displays log error type and extra log information
- User log entry
- Displays user defined value and extra log information
- Switch from task to task
- Starting new task
- Displays delay between request to start the task and actual time when task was started
- Ending task
- Displays remaining time until deadline if was specified by user, when task was created
- Switch from task to scheduler
- Switch from task to sleep
- Also DMON displays stack pointer at the time of context switch, CWP(current window pointer) and system state variable.
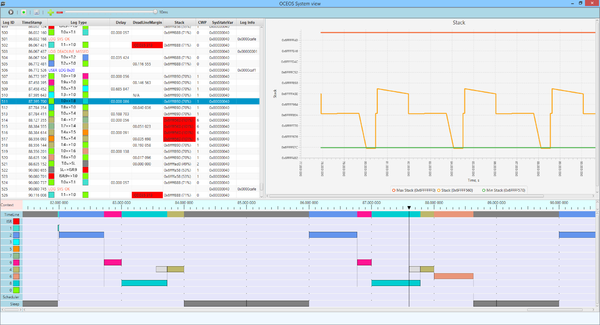
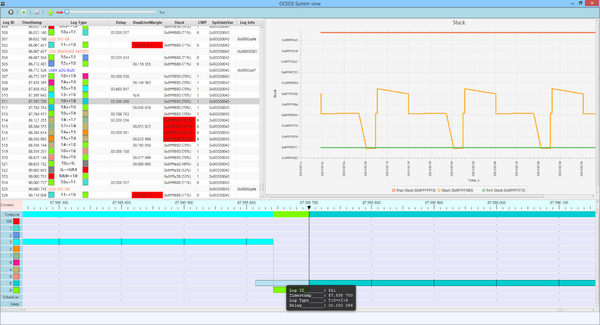
The table allows browsing through the list of log entries, moving from one context to another. Double click on any entry in the table sets the marker on the time line. Zoom in and out can be used only then to have a closer look at selected time frame. Time Line and Stack view are synchronized to match the currently selected entry.
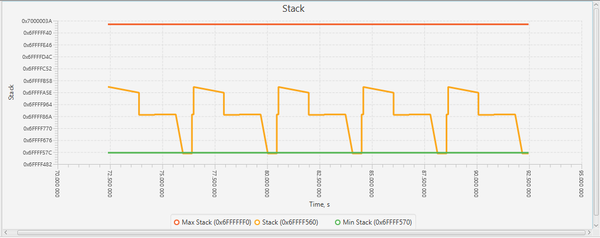
The Stack Graph below displays stack for the last minute. Stack displays between MIN and MAX values if specified by user in app_config.c
The Time Line view below displays system interaction by context over time. Each row presents the context. Tasks are ordered by its priorities, from higher to lower. The first row presents the overall context switch activities. The real time update of Time Line is possible only at 10ms scale by moving the scroll bar to the max on the right.
Task run time is shown as rectangle filled with task specific color.
Context switches marked with vertical lines.
Grey rectangle before task indicates the time from start request to actual task start.
DMON can detect buffer overrun. The message is printed to the console and red vertical line displayed on the Time Line View. If this happened, context switch log buffer size has to be increased.
Setting the marker by double clicking on the entry in the table
Zoom in to 1 micro second
Time Line view has some basic controls:
- Status (running/paused)
- Button to enable/disable command
- Save button (please see below)
- Slider to change time scale. It is disabled and defaults to 10ms while updating in real time.
Limitations:
- If Context switch buffer is too big it puts constrains on the link to the target. This can happen if the rate, at which the tasks are started, is very frequent. If this is the case then this feature cannot be used and cpuload command is the only choice, as it does not depend on buffer size.
oceos profile save <fileName>
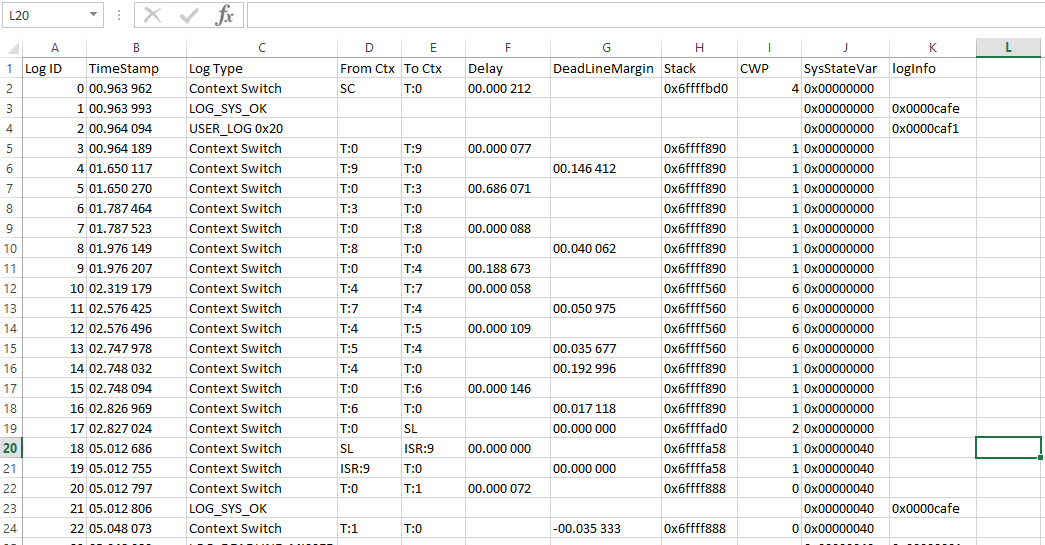
- oceos profile save saves context switch logging to the csv file. This command activates saving to the file. After all content is saved, it continues appending to the file. This command cannot be disabled. Every time when new image is loaded to the target, new csv file is created.
If fileName parameter is not specified, the file is created in DMON User directory: c:\Users\UserName\DMON\UserData
